聆聽測試 _ 失真判斷訓練
歡迎測試您的失真聆聽判斷能力;
這是一個 A/B 雙盲測, 在二個音訊之間選出較低失真的一個.
透過這個測試, 了解您在受測者的能力分佈, 訓練判斷能力之外並學習了解揚聲器典型的失真信號!
介紹
In the past, the impact of the linear (amplitude and phase) response on sound quality has been investigated by using linear filters (equalizer). Linear distortion, however, describe the loudspeaker adequately only at small amplitudes. At high amplitudes, real loudspeakers produce other kinds of distortion, which should also be investigated systematically. This can be done by using a nonlinear model of the loudspeaker that is able to synthesize loudspeaker output in the large signal domain.
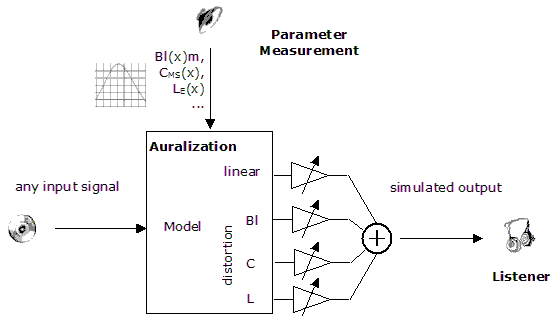
By measuring the parameters of the model, it is possible to perform a real-time simulation for any input, like music or artificial test signals, and to provide the distortion components separated from the ideal linear output.
What is left, is to pass the distortion and the linear signal through a mixing console, so the distortion is either emphasized or attenuated. This technique is called Auralization.

There are three major mechanisms in the electro-mechanical system that produce distortion:
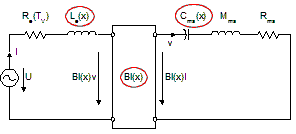
- Bl(x): The variation of the force factor with displacement
- CMS(x): The variation of suspension compliance with displacement
- LE(x): The variation of voice coil inductance with displacement
There are other nonlinear mechanisms as well, however, for most drivers, Bl, CMS and LE nonlinearities are by far the dominant sources of distortion.
建模
Classic modeling approximates the loudspeaker as a linear system: the response contains only frequency components that can be found in the input - if the input amplitude is doubled, the output is doubled, too.
The linear model assumes that all parameters are independent of displacement and time, this is why it is valid for small excursions only. At notable displacement levels, the voice coil moves out of the gap and the force factor decays, the suspension usually gets stiffer with displacement and the inductance changes. Thermal heating limits the output power and the suspension gets softer at the rest position. Unfortunately, these mechanisms interact strongly and so we end up with a nonlinear feedback system: adding new frequencies and a DC component and compressing the output. Additionally, the history of the loudspeaker is important, so the output depends not only on the instantaneous signal, but also on the signal from before.
 This extended loudspeaker model is derived from the common small signal model. It allows variation of certain parameters over time, displacement. The image to the left shows a simplified representation (click to enlarge).
The complete model we use includes additional effects, such as Para-Inductance, thermal power compression, jump out effect of the voice coil, nonlinear compression of the amplitude, and the complex interaction between the different nonlinearities.
Extensive research in the recent years has shown that this model describes the large signal behavior of a loudspeaker, or similar electro-dynamical transducer, correctly. It is also very easy to compare predicted results with classic distortion measurement.
聽覺技術
The auralization can predict the sound pressure output of the loudspeaker and it can as well provide state information such as displacement, velocity, voice coil temperature, etc.
This allows a direct correlation of the subjective listening impression and the objective parameters and states of a loudspeaker. The impact of individual nonlinearities can be assessed separately, which allows to track artifacts in the listening impression back to their physical cause.
測試設計
We prepared the listening test for two reasons: to provide a fairly non-technical introduction to the large signal behavior of loudspeakers and to collect statistical data for a systematic investigation of the audibility of loudspeaker distortion. For this, we need your help.
The test is an "enforced blind A/B comparison" meaning:
- The listener compares two samples A and B, and has to tell which one is the "bad" one (contains distortions)
- It is blind - the listener doesn't know which sample is the original signal and which the distorted
- It is enforced - there is no "I don't know" option: even if the listener is unsure, he is asked to tell his opinion. This helps digging into subconscious, intuitive decisions and avoids shyness effects, a.k.a "I do not answer to prevent saying something wrong". It is amazing how sensitive the human ear can detect distortion, even though you cannot say definitely what makes the difference. However, some patience is required from the listener, to satisfy the statistical requirements.
Each test uses a particular test signal (music or artificial), simulated for a particular driver or loudspeaker. Each test consists of multiple steps. In each step, the listener is asked to compare two samples.
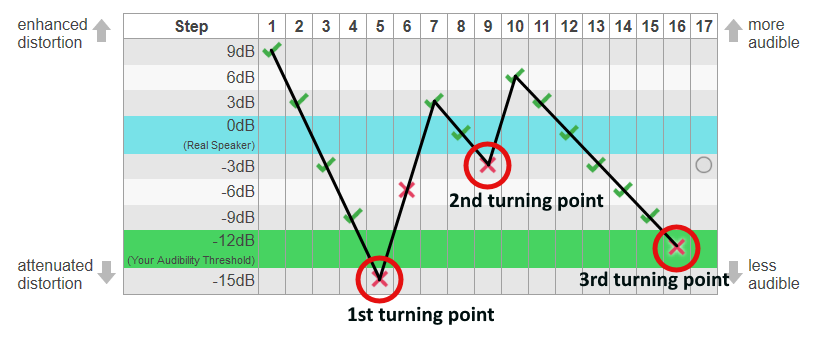
Samples are provided with the distortion enhanced or attenuated versus the linear signal (usually in 3 dB steps). e.g. "-9 dB" means the distortion component was attenuated by 9 dB, while the linear component is at 0 dB. The performance of the "Real Speaker" is obtained by neither attenuating nor enhancing distortion (both linear and distortion component are at 0 dB). Furthermore, a "linear" sample is provided, where the distortion is attenuated by 100 dB.
The listener always compares the linear to a distorted sample. The listener is asked to identify the distorted sample. The position (A or B) of the linear sample is randomized.
To see how the test is evaluated, let's have a look at an example test:

The test starts at high distortion levels (distortion enhanced by +9 dB), which are easy to hear. If the listener identifies the distorted signal correctly, the test goes down by two level steps. This is repeated until step 5, where the listener judges incorrectly. The level of step 5 (-15 dB) is marked as first turning point and the test goes up by three level steps to make the identification easier. From now on, the test uses one level step of attenuation for every correct anwer. If a wrong answer is given, the distortions are increased by three level steps. The levels where the listener ansered wrong are marked as "turning points" as well. For consecutive errors (like step 5 and step 6), the lowest level counts.
The test continues until three turning points are found. In the sample, this is at -15 dB, -3 dB and -12 dB. The distortion audibility threshold - where the listener can no longer tell the distorted signal apart - is determined as median of the three turning points, i.e. the turning points are sorted - -15 dB, -12 dB, -3 dB, and the center one is taken: For this test, the threshold is -12 dB.
Note: the median is not the average of the values - the average for the test would be -10 dB. The median is more resilient towards single lucky (or unlucky) guesses.
The test provides a chart showing the distribution of thresholds for a single signal/speaker combination. Individual test results are retained for a more specific analysis.
Reference for the Test Method: Kaernbach, C., "Simple adaptive testing with the weighted up-down method", Perception & Psychoacoustics 1991, 49(3), 227-229
